Examples of matplotlib (Image/Data) Visualizations - Python for Integrated Circuits - - An Online Book - |
|||||||||||||||||||||||||||||||||||||||||||||||||||||||||
| Python for Integrated Circuits http://www.globalsino.com/ICs/ | |||||||||||||||||||||||||||||||||||||||||||||||||||||||||
| Chapter/Index: Introduction | A | B | C | D | E | F | G | H | I | J | K | L | M | N | O | P | Q | R | S | T | U | V | W | X | Y | Z | Appendix | |||||||||||||||||||||||||||||||||||||||||||||||||||||||||
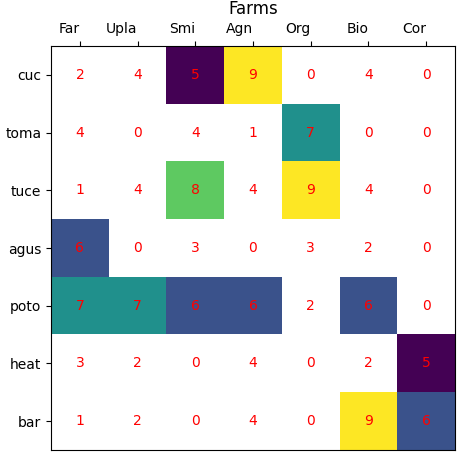
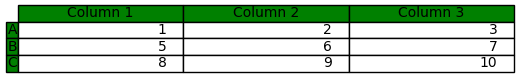
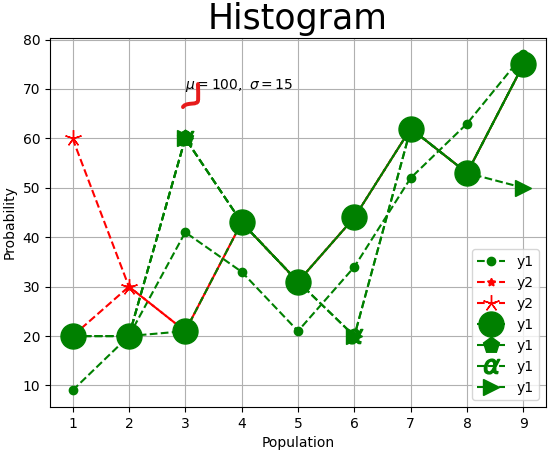
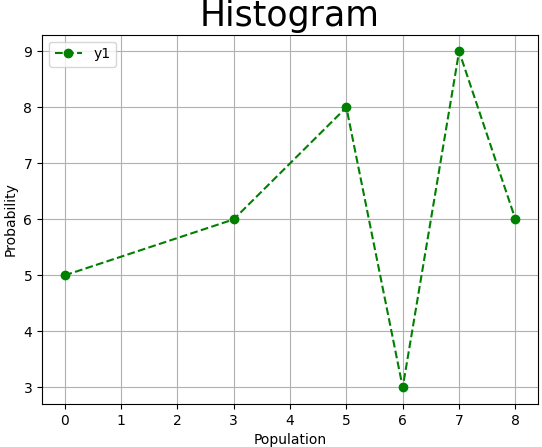
================================================================================= Table 4196. Examples of matplotlib (image/data) visualizations.
============================================
|
|||||||||||||||||||||||||||||||||||||||||||||||||||||||||
| ================================================================================= | |||||||||||||||||||||||||||||||||||||||||||||||||||||||||
|
|
|||||||||||||||||||||||||||||||||||||||||||||||||||||||||