|
||||||||
Confusion Matrix Heatmap - Python Automation and Machine Learning for ICs - - An Online Book - |
||||||||
| Python Automation and Machine Learning for ICs http://www.globalsino.com/ICs/ | ||||||||
| Chapter/Index: Introduction | A | B | C | D | E | F | G | H | I | J | K | L | M | N | O | P | Q | R | S | T | U | V | W | X | Y | Z | Appendix | ||||||||
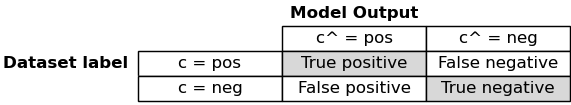
================================================================================= The confusion matrix is a two-dimensional array comparing predicted category labels to the true label. For binary classification, these are the True Positive, True Negative, False Positive and False Negative categories. A confusion matrix heatmap is a visual representation of a confusion matrix using colors to highlight patterns and relationships within the matrix. A confusion matrix is a table used in classification tasks to assess the performance of a machine learning model by showing the count of true positive, true negative, false positive, and false negative predictions made by the model for each class. Here's a breakdown of the components of a confusion matrix:
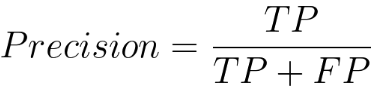
A confusion matrix heatmap takes this table of values and represents it visually using colors. Typically, the cells of the matrix are color-coded based on their values, making it easier to spot patterns and errors in the model's predictions. Darker colors might represent higher values (e.g., a large number of true positives or true negatives), while lighter colors might represent lower values (e.g., few false positives or false negatives). A confusion matrix heatmap is a powerful tool for understanding the strengths and weaknesses of a classification model. It can help you quickly identify which classes the model is performing well on and which classes it's struggling with. This visualization can guide you in making adjustments to your model or improving the quality of your data to enhance its performance. Confusion matrix (code) is as below: In a confusion matrix, as shown above, rows typically represent the actual or true labels of the data, while columns represent the predicted labels (the labels with a modification, such as a hat or caret (^) on top of the letter) made by a model. This matrix helps to assess the performance of a classification algorithm by showing how well it predicts each class. The diagonal elements of the matrix represent correct predictions, while off-diagonal elements indicate misclassifications. Heatmaps are often used to visually represent the confusion matrix, with colors indicating the intensity of predictions or errors. The precision of the model can be given by,
where,
The precision of a classification model is a measure of its accuracy when it predicts the positive class. Equation 4022a calculates the ratio of correctly predicted positive instances (True Positives) to the total instances predicted as positive (sum of True Positives and False Positives). In other words, precision tells us the percentage of cases predicted as positive by the model that were actually positive. The recall of the model can be given by,
where,
The recall, also known as sensitivity or true positive rate, is another performance metric for classification models. Equation 4022b calculates the ratio of correctly predicted positive instances (True Positives) to the total actual positive instances (sum of True Positives and False Negatives). In other words, recall tells us the percentage of actual positive instances that were correctly predicted by the model. It's a useful metric when the cost of false negatives is high, and we want to minimize the number of actual positive instances that are missed by the model. False Positive Rate is given by,
Equation 4022c calculates the ratio of false positives to the sum of false positives and true negatives. It measures the proportion of actual negatives that are incorrectly classified as positives. False Negative Rate is given by,
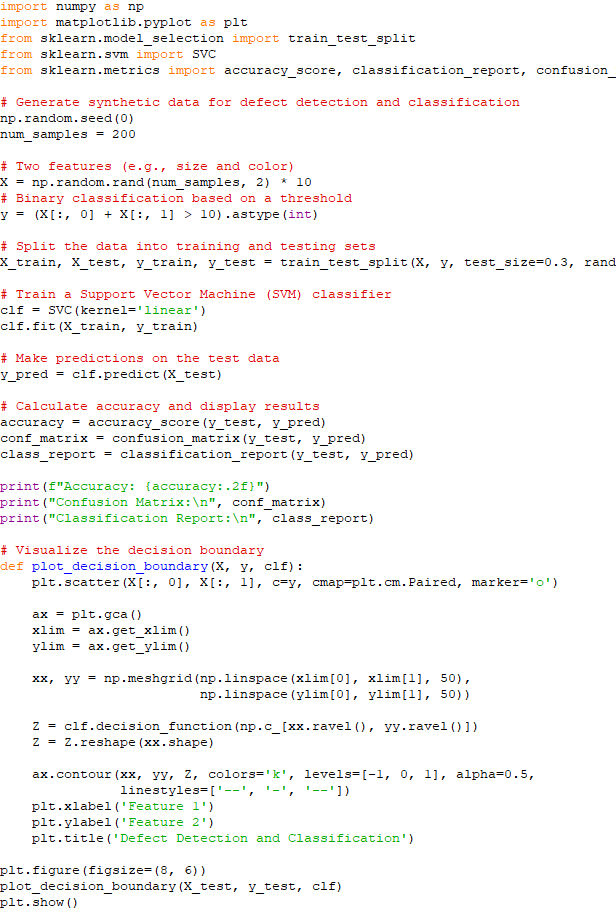
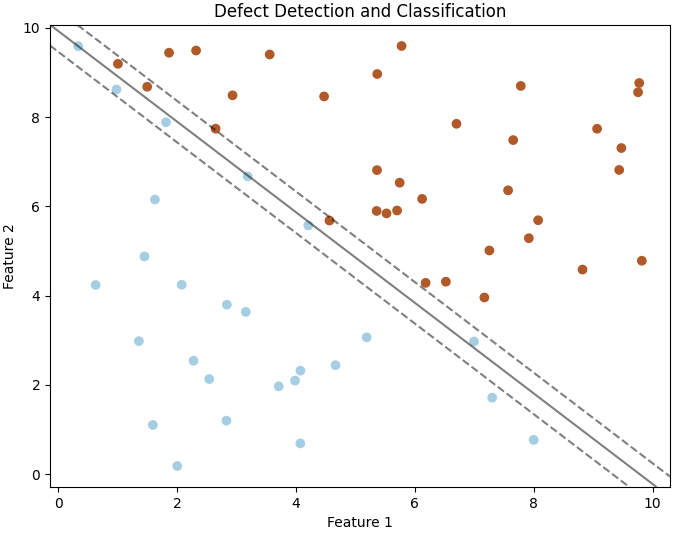
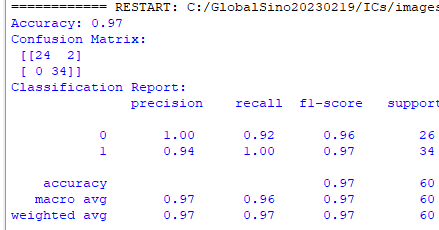
False Negative Rate is also referred to as the Miss Rate or False Negative Proportion. Equation 4022d calculates the ratio of false negatives to the sum of false negatives and true negatives. It represents the proportion of instances that are actually positive but were incorrectly predicted as negative by the model. In other words, the False Negative Rate is a measure of how many positive instances were missed or "falsely omitted" by the model. It is particularly relevant in scenarios where the cost or consequences of missing positive instances (false negatives) is high. Precision and recall are often in a tradeoff relationship, meaning that improving one may come at the expense of the other. This tradeoff is particularly evident when adjusting the threshold for classifying instances as positive or negative in a model. High Precision: A model with high precision is good at correctly identifying positive instances, but it may have a higher chance of missing some positive instances (false negatives). This is because it is being conservative in labeling instances as positive. High Recall: A model with high recall is good at capturing a large proportion of actual positive instances, but it may also have more false positives. This is because it is being more inclusive in labeling instances as positive. By adjusting the decision threshold, we can influence the balance between precision and recall. Finding the right balance depends on the specific goals and requirements of the application. In some scenarios, precision may be more critical, while in others, recall may take precedence. It's essential to consider the tradeoff based on the context and consequences of false positives and false negatives in a particular task. ============================================ Defect Detection and Classification. Code: ============================================
|
||||||||
| ================================================================================= | ||||||||
|
|
||||||||

 ----------------------------------------------- [4022a]
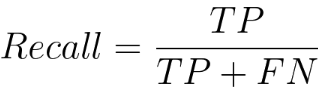 ----------------------------------------------- [4022b]
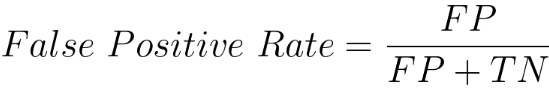 ----------------------------------------------- [4022c]
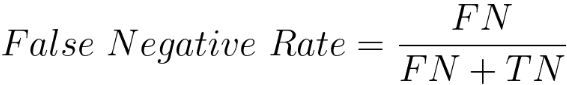 ----------------------------------------------- [4022d]