"Model"versus "Hypothesis" - Python Automation and Machine Learning for ICs - - An Online Book - |
||||||||
| Python Automation and Machine Learning for ICs http://www.globalsino.com/ICs/ | ||||||||
| Chapter/Index: Introduction | A | B | C | D | E | F | G | H | I | J | K | L | M | N | O | P | Q | R | S | T | U | V | W | X | Y | Z | Appendix | ||||||||
================================================================================= In machine learning, the terms "model" and "hypothesis" are related concepts, but they serve slightly different roles and are used in different contexts:
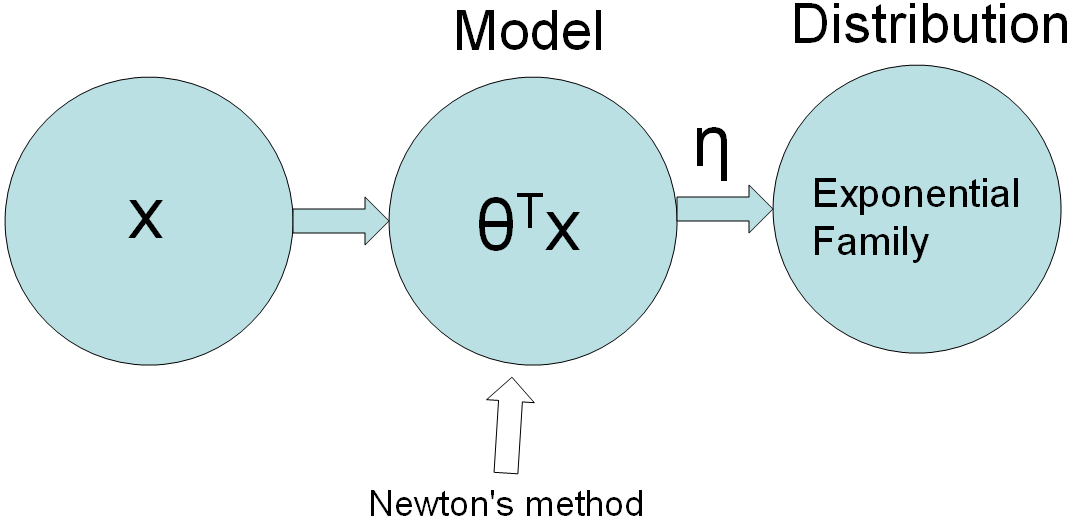
Figure 3985 and Equation 3985a shows the linear learning model interaction with input and distribution. During learning process, a model learns parameters like θ through the learning process but the ditribution is not learnt. These parameters capture the relationships between input features and the target variable. the distribution of the data, which represents the underlying statistical properties of the dataset, is typically not learned explicitly in many machine learning models. Instead, the model makes certain assumptions about the distribution (e.g., assuming a normal distribution) but doesn't directly estimate the entire distribution. This separation of learning parameters and modeling the data distribution is a common practice in various machine learning algorithms.
Figure 3985. Linear learning model. In machine learning, the function "h" typically represents the hypothesis or the prediction function associated with a model. The function "h" is used to make predictions or estimates based on input features or variables. Here's a general representation:
The choice of the letter "h" is a convention and is used to denote the hypothesis or prediction function. It's important to note that "h" may take different forms and structures depending on the specific machine learning algorithm or model being used. The ultimate goal is to learn the parameters or weights of "h" from the training data to make accurate predictions on new, unseen data. The function "h" can be expressed as follows: h: x → y, namely mapping from y to -- x to y.
The arrow "→" signifies the mapping from the input space to the output space. In other words, "h" describes how the model transforms or maps the input data "x" to the predicted output "y." For example, in linear regression, the hypothesis function might be written as: h(x) = θ₀ + θ₁x₁ + θ₂x₂ + ... + θₙxₙ In this case:
The goal in machine learning is to find the values of the parameters (such as θ₀, θ₁, etc.) that minimize the difference between the predictions "h(x)" and the actual target values "y" in the training data. This mapping from input to output is fundamental to the function "h" in supervised learning. ============================================ Text classification based on the values in ColumnA to predict the values for ColumnB. To achieve this, a text classification model is used below. In this example, a simple Multinomial Naive Bayes classifier from the sklearn library is applied to classify the new string in ColumnA and predict the corresponding value for ColumnB. This uses the trained model to predict values for a new string from the CSV file. Note that for more complex scenarios, more advanced text classification techniques and more training data are needed. Code: The code above belongs to the Multinomial Naive Bayes algorithm. In this code, the "model" corresponds to the Naive Bayes classifier (clf), and the "hypothesis" is not explicitly defined because the code is not implementing linear regression, which is where the concept of a hypothesis function is typically used. Here's the relevant part of the code: # Train a Naive Bayes classifier In this code, clf is the machine learning model, specifically a Multinomial Naive Bayes classifier. This model has learned relationships between the input features (X_train_vec) and the target labels (y_train). The model serves as the predictive component that assigns labels to new data points based on the learned patterns in the training data. The concept of a "hypothesis" is typically associated with linear regression, where you have a linear equation (hypothesis function) representing the relationship between predictors and a continuous target variable. In the code above, you are working with a classifier, and the terminology used in classification tasks doesn't involve a "hypothesis" in the same way as linear regression. Instead, classifiers make predictions based on learned probability distributions and decision rules. ============================================
|
||||||||
| ================================================================================= | ||||||||
|
|
||||||||