Functional margin in ML - Python and Machine Learning for Integrated Circuits - - An Online Book - |
||||||||
| Python and Machine Learning for Integrated Circuits http://www.globalsino.com/ICs/ | ||||||||
| Chapter/Index: Introduction | A | B | C | D | E | F | G | H | I | J | K | L | M | N | O | P | Q | R | S | T | U | V | W | X | Y | Z | Appendix | ||||||||
================================================================================= In machine learning, functional margin is often associated with support vector machines (SVMs), which are a type of supervised learning algorithm used for classification and regression tasks. The functional margin is a concept used to measure the confidence or distance of a data point from the decision boundary or hyperplane that separates different classes in SVMs. Here's a more detailed explanation of the functional margin in the context of SVMs:
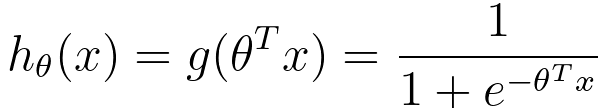
For logistic regression, hypothesis fuction is given by: This equation is used to predict the probability of the observation belonging to one of the two classes. When this model is used for binary classification, you can make predictions as follows:
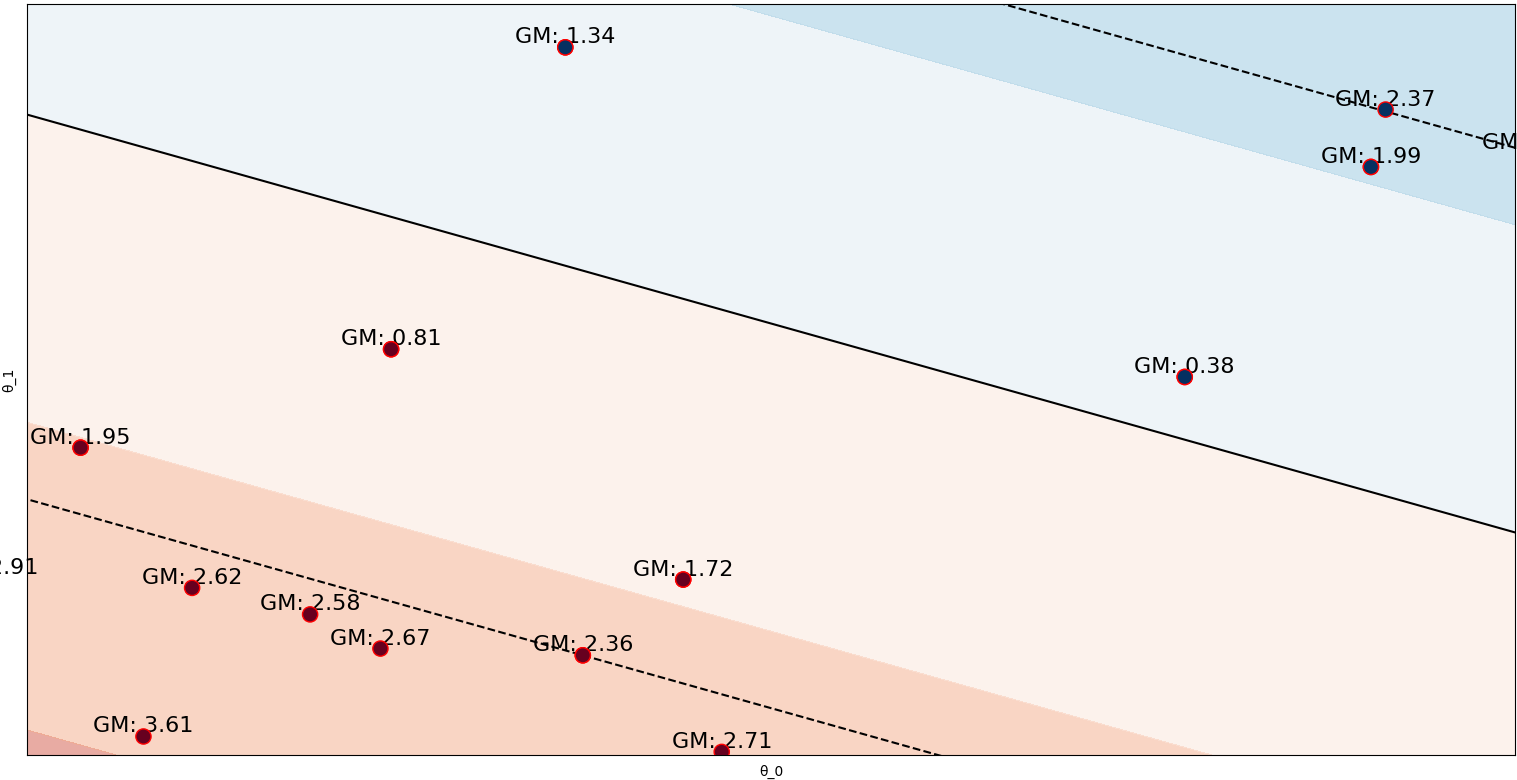
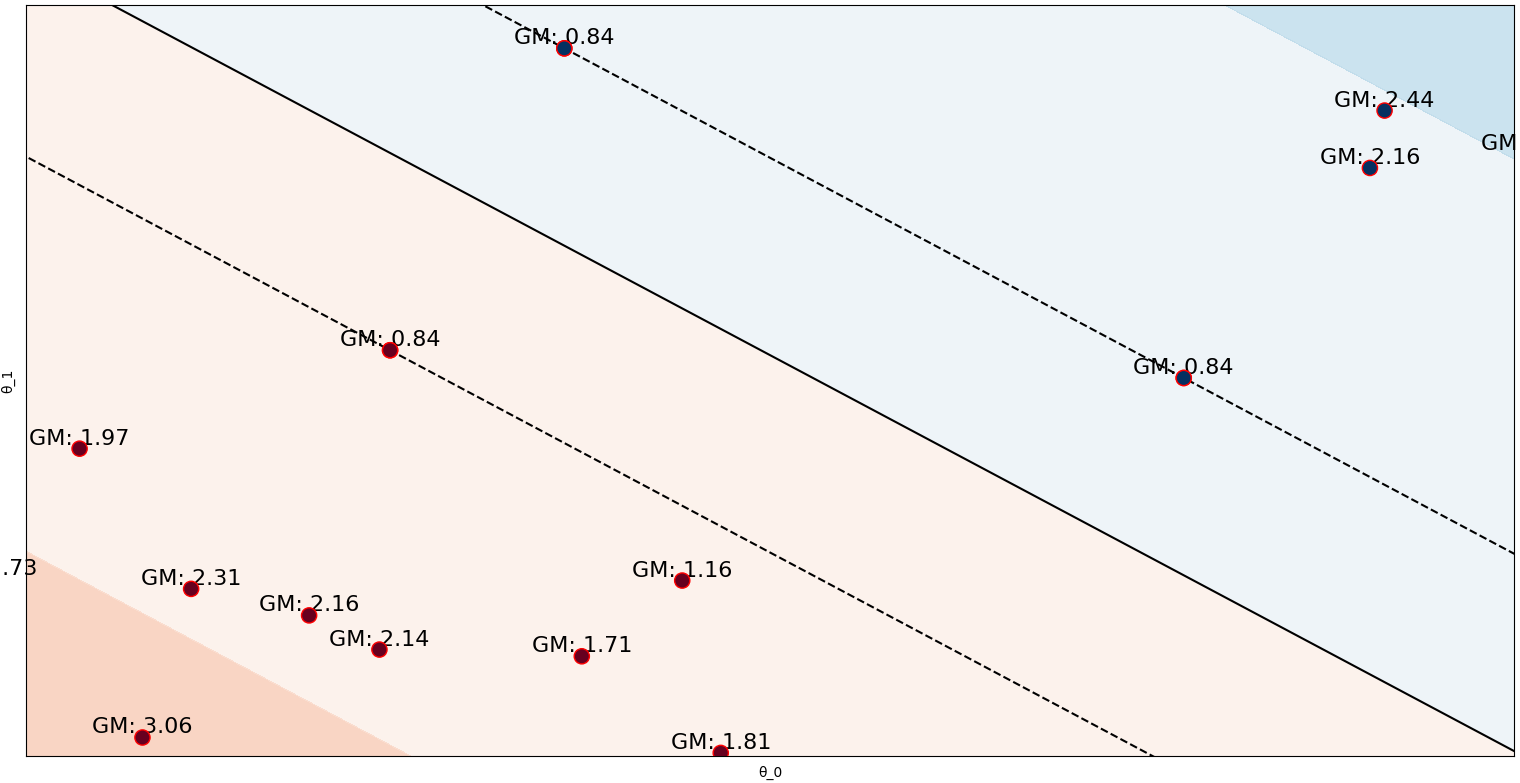
That means if we have y(i) = 1, then we expect θTx(i) >> 0, and if we have y(i) = 0, then we expect θTx(i)<< 0. Therefore, we can conclude: i) Functional Margin in SVM: In an SVM, the functional margin is used to measure the confidence or separation of a data point from the decision boundary (hyperplane) that separates different classes. Mathematically, it's defined as: where, f(i) is the functional margin for the ith data point. y(i) is the class label of the ith data point (+1 or -1). θT is the transpose of the weight vector of the hyperplane. x(i) is the feature vector of the ith data point. ii) Expectations for y(i) = 1 and y(i) = 0: When y(i) = 1, it means the ith data point belongs to the positive class. In this case, we expect a positive functional margin (f(i) > 0), and θTx(i) should be significantly greater than 0. This indicates that the data point is confidently classified as belonging to the positive class and is positioned well on the correct side of the decision boundary. When y(i) = 0, it means the ith data point belongs to the negative class. In this case, we expect a negative functional margin (f(i) < 0), and θTx(i) should be significantly less than 0. This indicates that the data point is confidently classified as belonging to the negative class and is positioned well on the correct side of the decision boundary. A positive functional margin for and a negative functional margin for reflect the model's confidence in classifying data points and their positions with respect to the decision boundary. Figure 3816 shows the functional margin and geometric margin in two datasets.
(a)
(b)
============================================
|
||||||||
| ================================================================================= | ||||||||
|
|
||||||||
 ---------------------- [3876a]