=================================================================================
Assuming we have a dataset containing the fail rates of semiconductor wafers under 40 different test bins (data) as shown in Figure 3278. The dataset includes five columns, each representing one of five wafers, with the fail rates measured for each. The wafers were fabricated using different combinations of 10 possible conditions. Specifically, Wafer1 was fabricated under Conditions 1 and 2; Wafer2 under Conditions 1, 2, 3, 6, and 9; Wafer3 under Conditions 1, 8, 9, and 10; Wafer4 under Conditions 1, 2, 3, 5, and 7; and Wafer5 under Conditions 1, 4, 5, and 8. We want to perform a fail analysis to understand the relationships between these varying fabrication conditions and the observed fail rates across the different bins. This will involve identifying any patterns or correlations that may exist between the conditions and the fail rates, which could help in pinpointing specific conditions that lead to higher fail rates, thereby facilitating improvements in fabrication processes. Table 3278a shows different methods which are used to analyzing the impact of fabrication conditions on semiconductor wafer fail rates.
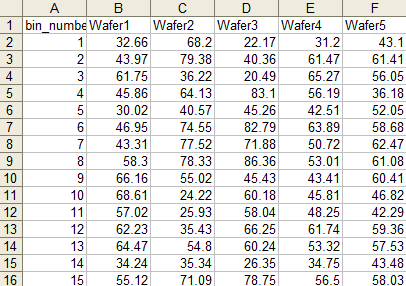
Figure 3278. fail rates of semiconductor wafers.
To analyze the fail rates of the different wafers and their fabrication conditions effectively, some analytical approaches can be used:
- Statistical Analysis:
- Descriptive Statistics: Calculate mean, median, standard deviation, and variance for each wafer to get a basic understanding of the distribution of fail rates.
- Comparative Analysis: Compare the statistical metrics across wafers to see how different conditions may influence the fail rates. For example, examining how the presence of Condition 3 in Wafer 2 and Wafer 4 affects the fail rates compared to wafers without this condition.
- Visualization:
- Heatmaps: Create heatmaps of fail rates per bin for each wafer. This visual representation can help in quickly identifying patterns or anomalies in fail rates across different conditions.
- Box Plots: Use box plots to compare the distribution of fail rates across the wafers. This can visually highlight differences and similarities in the fail rates due to different fabrication conditions.
- Correlation Analysis:
Correlation analysis can be performed to see if there's a straightforward linear relationship between the fail rates and the fabrication conditions.
- Correlation Coefficients: Compute the correlation coefficients between the fail rates of wafers that share common fabrication conditions. This can help in understanding if certain conditions tend to lead to similar fail outcomes.
- Factorial Analysis: If the dataset is extended with more specific details on the process parameters for each condition, factor analysis can be used to identify which conditions have the most significant impact on fail rates. Since we have multiple conditions impacting each wafer, a factorial design analysis might be beneficial. This type of analysis can help us understand not just the individual effect of each condition but also the interaction effects between them.
For this purpose, a linear regression approach, where each fabrication condition will be treated as a categorical independent variable, can be used, and the interaction effects between them can be studied.
We can encode the fabrication conditions in the program and prepare the dataset for analysis. This script encodes the conditions, and fits a regression model to estimate the effects of each condition and their interactions on the fail rates for one specific bin. To perform the regression analysis for each wafer separately, here we loop through each wafer's column in the DataFrame independently. This will generate a regression model for each wafer's fail rates across the bins:
- Loop Over Each Wafer: The script loops over each wafer and fits a regression model using that wafer's fail rates as the response variable and the conditions affecting that particular wafer as predictors.
- Predictors Selection: For each wafer, it only considers the conditions that apply to that particular wafer. This makes each model specific to the conditions affecting its fail rates.
- Results Output: Finally, the script prints out the summary of each regression model, allowing us to review the coefficients and statistics for each wafer's model.
An example (script) of outputs is:
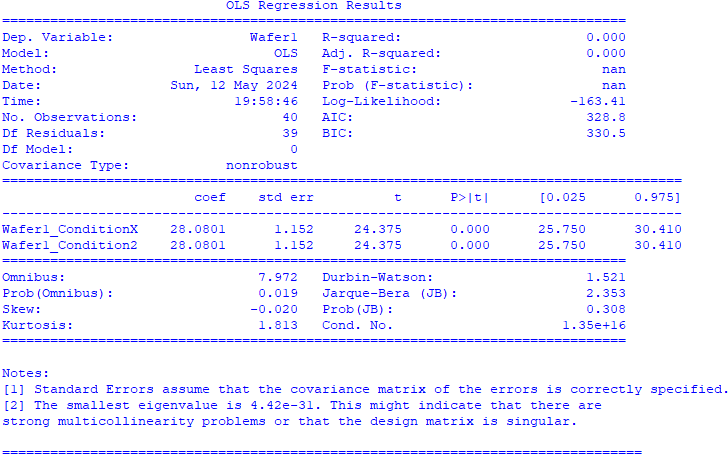
The output from the modeling is the summary of an OLS (Ordinary Least Squares) regression model, with key components of this output (see details at page3277).
-
Hypothesis Testing:
- ANOVA: Conduct an Analysis of Variance (ANOVA) to determine if there are statistically significant differences in the fail rates across wafers that can be attributed to different fabrication conditions.
- Regression Analysis: Use regression models to predict fail rates based on fabrication conditions, and to understand the impact of each condition on the fail rates.
- Machine Learning:
- Clustering: Apply clustering algorithms (e.g., K-means, hierarchical clustering) to group wafers or bins based on similarity in fail rates. This can help in identifying patterns that are not immediately obvious.
- Decision Trees: Build decision trees to classify fail rates based on conditions, providing insights into which conditions contribute most to high or low fail rates.
- Iterative Analysis
- After initial findings, we might need to refine our models or try different analyses based on the insights we gain. It's often an iterative process.
The impact of fabrication conditions on semiconductor wafer fail rates can also be analyzed by Factor Analysis Model (see page3693).
|